Service / Org ecosystem mapping
The Universal Service Graph: treating services and organisations as connected, queryable models rather than static documents, so that relationships, impacts, and gaps become traceable.
- Status
- still going
- Since
- 2025
- Topics
- Service Design · Org Design
Ecosystem maps and org charts share a fundamental problem: they show one type of relationship, present it as the full picture, and discard everything else. The moment an organisation changes, they’re wrong. The more complex the service, the faster they become outdated or too cluttered to read.
This exploration asks whether graph databases offer a better foundation. A graph represents services and organisations as networks of connected nodes (people, teams, tools, activities, channels, journeys) rather than as a fixed picture of one type of relationship. Unlike a static map, a graph is queryable: trace how a customer journey threads through teams and tooling, see what skills a proposed new activity requires, or model the consequences of removing a system before committing to the decision.
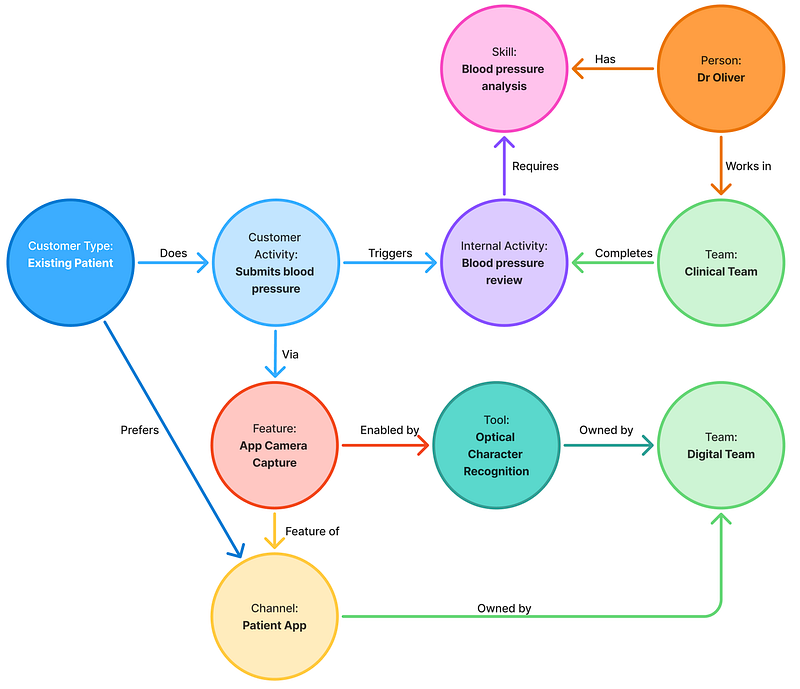
The output is the Universal Service Graph: a tool that holds a service, the organisation delivering it, and the ecosystem it sits within as a single connected model. Journey views generate from the data rather than needing to be built and maintained by hand. Initiatives link to the objectives they serve, making the cascade from strategy to activity visible. Impact modelling becomes a seconds-long query rather than a multi-day exercise.
The honest limitation: a graph can tell you what exists and how it connects. It can’t tell you what something feels like to use. Research and co-design remain fundamental. The question is what decisions look different when the structural picture is this much clearer.
Related links
From passive maps to active models: introducing the Universal Service Graph